+1-888-201-6088 | email@nevronoffice.com
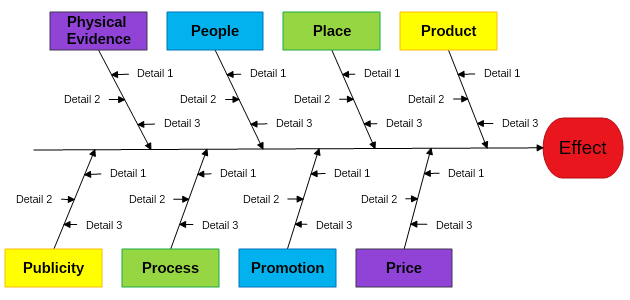
The Management Industry Fishbone Diagram represents the core structure of a Management Cause and Effect diagram. The template contains of all 8 main P’s for the industry – Product, Price, People, Place, Process, Promotion, Publicity and Physical Evidence. Download for free and edit the “Details” of each cause.
 |
We use cookies to allow us to automate the access and the data entry functions of our website and to correlate online ordering information for purchases you may make while at the website (if any), tailor our website to your preferences or interests, or customize promotions or marketing. For full details read our cookie policy.